Turning Movement Count
In this guide, we will use Vaas to count the number of cars passing through a junction in one particular direction. This can be extended to get the counts in all of the possible turning directions through the junction. We will use traffic camera footage.
We will also use the Vaas parameter tuning tool to demonstrate how it can help optimize query accuracy and execution speed.
If you haven't already, you should deploy Vaas.
Data
Let's start by importing the traffic camera footage dataset.
- Download the dataset from https://favyen.com/vaas-data/tokyo-traffic-footage.zip.
- In your Vaas deployment, go to Timelines, press Add Timeline, and create a new timeline. Then, press Manage on the timeline, press Add Data Series, and add a video data series.
- Press Manage on the data series, and import the data. You could upload the zip file, or import from a zip file or folder on local disk (you may need to use docker cp).
- Create a vector containing just the one video data series. Later we will run queries on the vector.
Should look like this:

Detecting Cars
Next, let's train several object detectors at different input resolutions to detect cars. You can also try applying a YOLOv3 model pre-trained on the COCO dataset, but it may not work as well as a model trained specifically on this dataset.
- Download our exported annotations from https://favyen.com/vaas-data/tokyo-detection-export.zip, and use the "Import Timeline from Export" option to import it into Vaas.
- Create a new vector [tokyo images, tokyo car detections] in the new timeline.
- From Queries, create a new query, and add a new YOLOv3 object detector node.
- Add Input 0 as a parent for the YOLOv3 node.
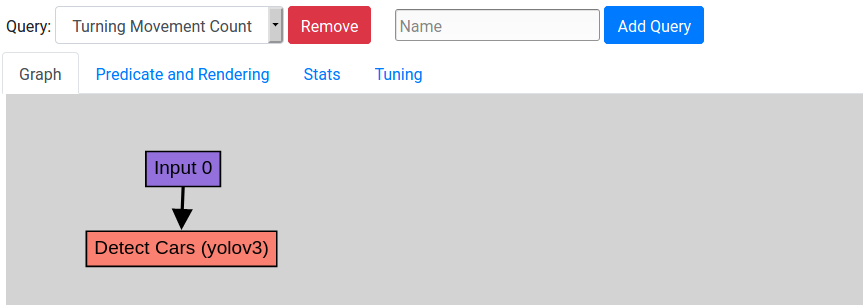
The query graph should look like this:
To train a model, select the YOLOv3 node, press Edit Node, and configure the training data, input width, and input height at the bottom, like this:
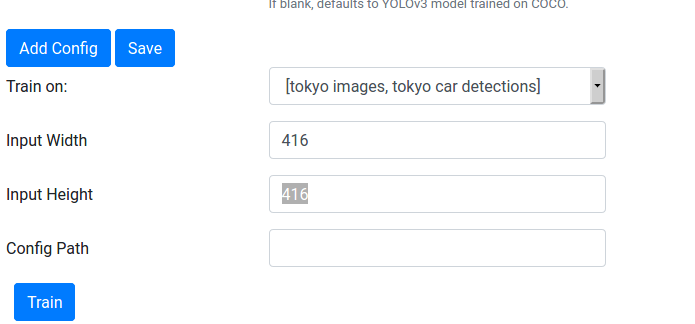
Leave the Config Path blank. Try training a model at these input resolutions:
- 416x416 (corresponds to the full resolution video)
- 320x320
- 256x256
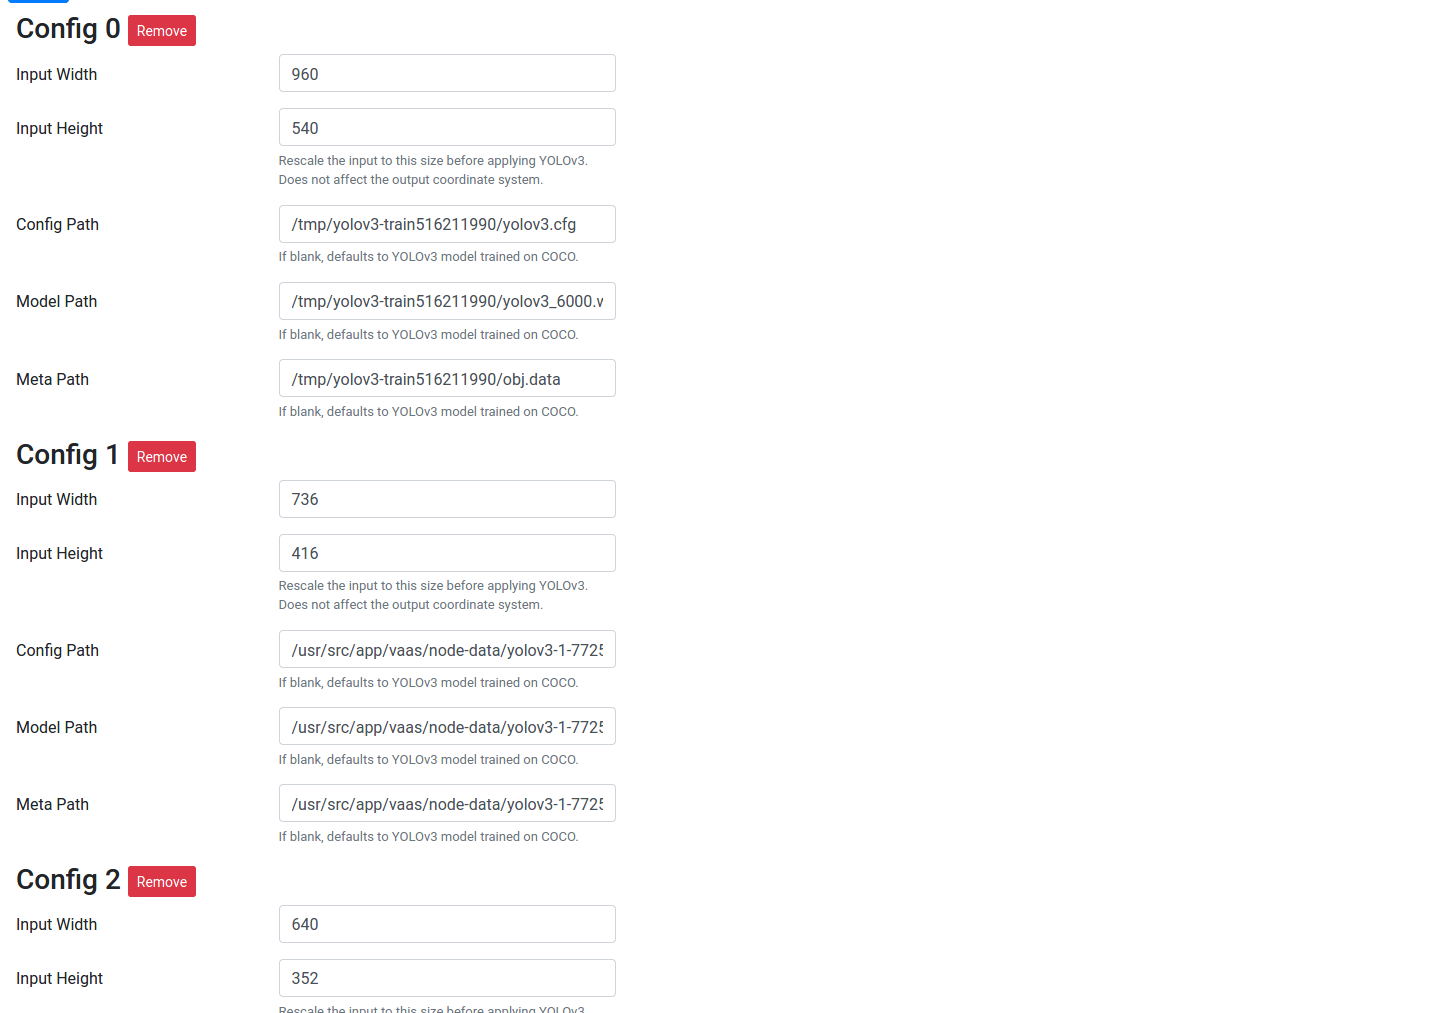
After training each model, Vaas will append a new section to the node configuration. Since the training data consists of square crops, but the video data is a larger, rectangular image, you will need to change the input size from 416x416 to 960x544, 320x320 to 736x416, and 256x256 to 640x352. After training and updating the configuration, the YOLOv3 node should look like this:
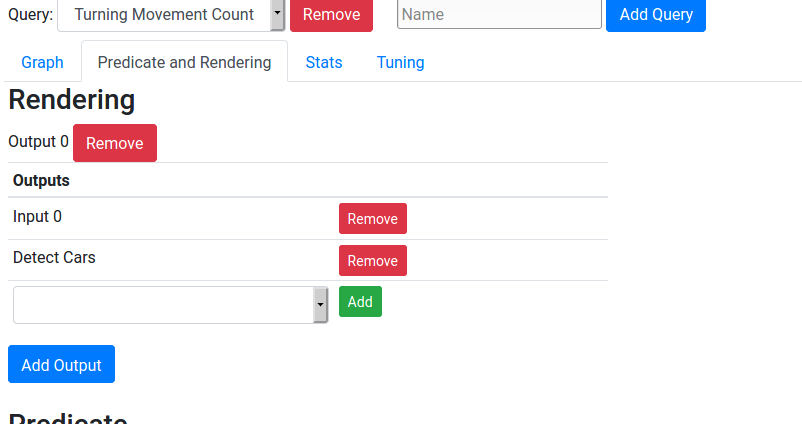
Now you can go to Predicate and Rendering, add Input 0 and the YOLOv3 node to the output rendering, and run the query on [Tokyo Traffic Footage] from Explore. Vaas will use the first model configured at the node during query execution.

Tuning
Which input resolution should we use for the detector? The parameter tuner will give us speed and accuracy data for various parameters (e.g. model configurations) to help us make a decision.
First, though, we need to label several end-to-end outputs. We will label the number of cars going from the left to the right in several video samples.
- From Annotate, create a new label series. The data type is Integer, source is the traffic camera dataset, and tool is default-int.
- Set the # Frames to 750 and Range to 0. This will give us 30-second video samples, where we can enter any integer we like.
- Label 20+ samples with the number of cars that went from the left side to the right side. You can decide the threshold on either side arbitrarily, since you will later be drawing polygons to define what is the left side and what is the right side.
- If needed, you can press Prev and then Prev/Next to go through samples that you labeled.
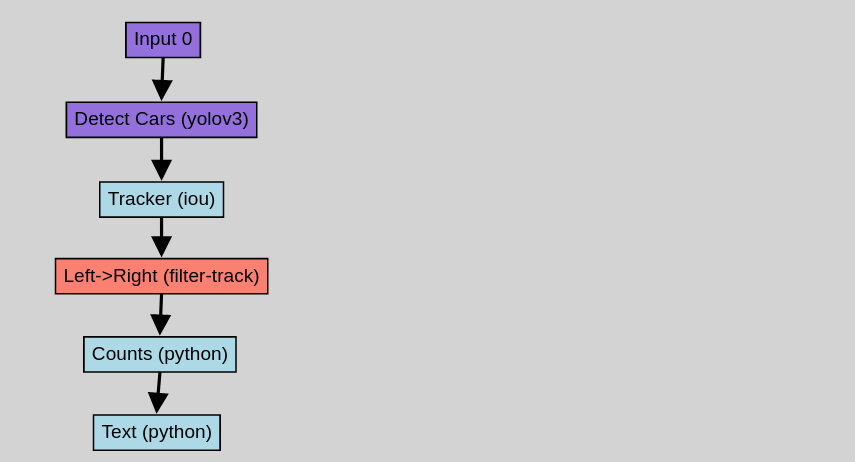
Now, let's update the query to output counts instead of detections. Add four nodes to the graph:
- An IOU tracker (under Heuristics).
- A Track Filter.
- A custom Python node that outputs Integer. We will count the cars in this node.
- Another custom Python node that outputs Text. We don't need this node for tuning, but we will use it to visualize the counts.
Your graph should look like this:
In the Track Filter, set the Dataset to the traffic camera video, and then press Add Shape. Draw a polygon around the left side of the junction, something like this:
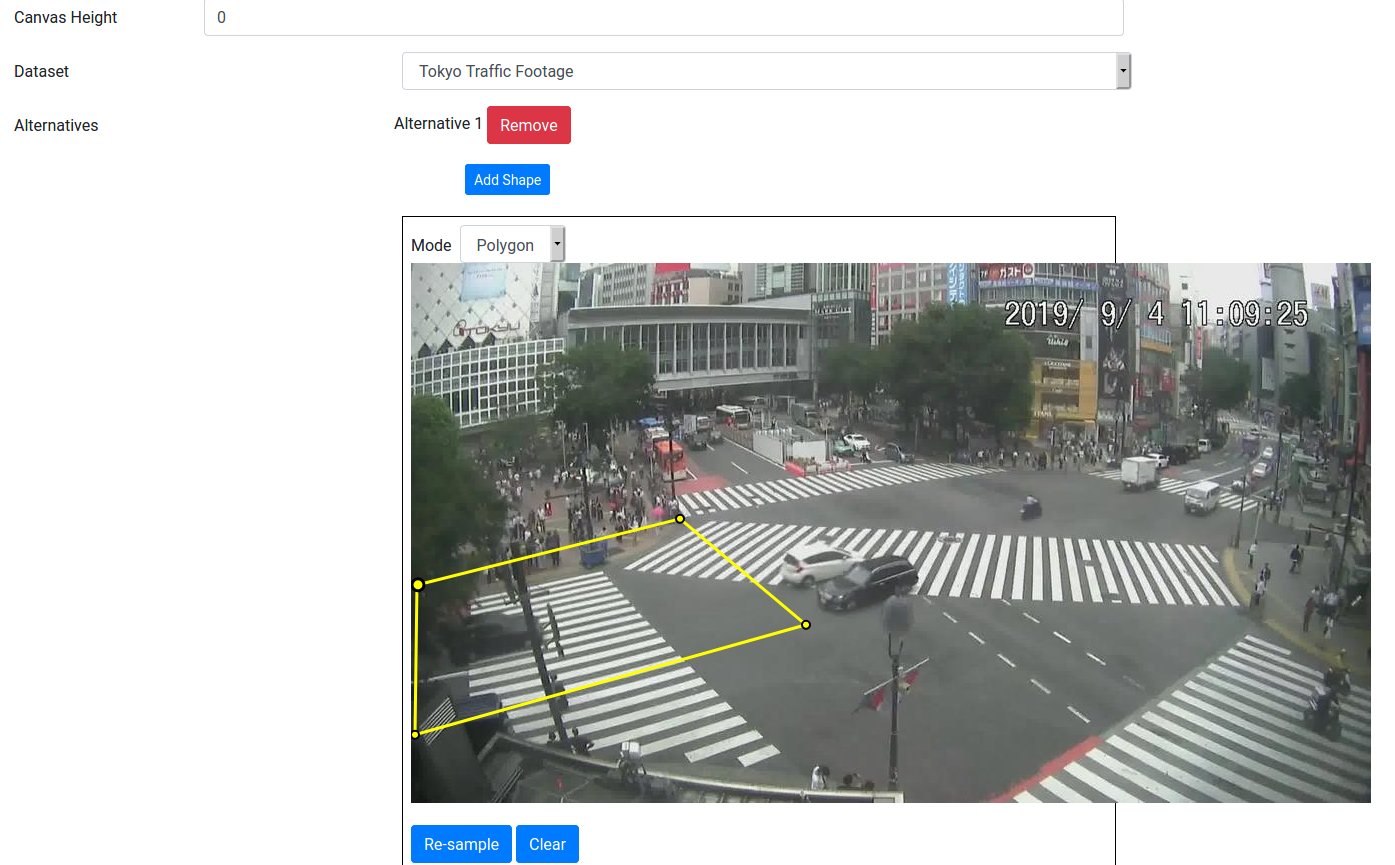
Press Add Shape again, and do the same for the right side. The track filter will only select tracks that start in the first shape, and end in the second shape. (Actually, if you change the Matching Mode to Set, then it would match tracks that go through the shapes in any order. But that's not what we want, so keep it as Sequence.)
In the counts Python node, copy and paste this code, which counts the number of tracks that passed the track filter:
@lib.all_decorate
def f(detections):
    tracks = lib.get_tracks(detections)
    return [len(tracks)]*len(detections)
Finally, in the text Python node, paste this code, which converts each count integer to a string:
@lib.per_frame_decorate
def f(count):
    return {'Text': 'Count: {}'.format(count)}
Update the output rendering to consist of Input 0, Tracker, and Text. Now, when running the query, you should see outputs with the counts annotated in the top left:

So we got the counts, but what we actually wanted to do was to tune the YOLOv3 configuration. So let's do that now. Go back to Queries, and open the Tuning sub-tab. We want to tune the YOLOv3 node on the traffic camera dataset, and we will use our annotation set as the ground truth, the counts Python node as the output node, and "min-over-max" as the metric. After pressing Tune, it should look like this:
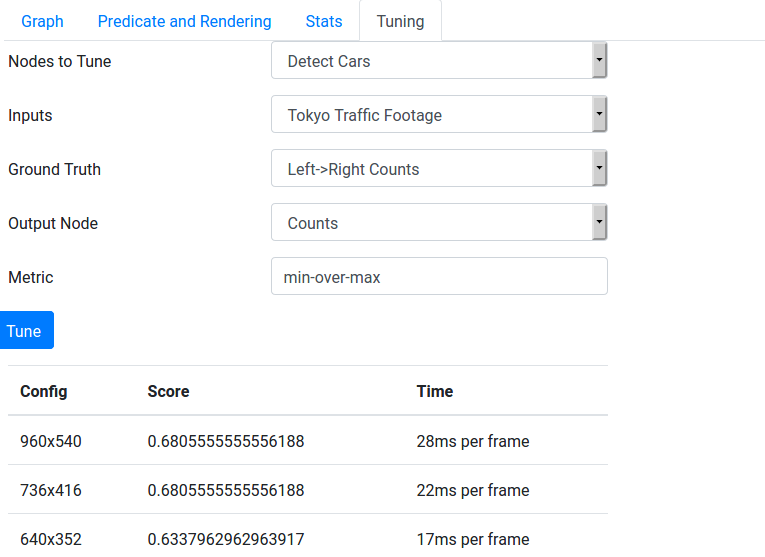
Based on the tuning results, we could decide which detector configuration to use.
Improving the Tracker
Even with the best detector configuration, the min-over-max accuracy is not so good (likely less than 75%). This is primarily because cars moving from left to right are frequently occluded by cars moving in the opposite direction. To improve accuracy, we can train a self-supervised tracker that tracks cars more robustly than the IOU heuristic-based tracker.
Coming soon.